Google

Aug 22, 2014

What are the different ways a Java thread gets blocked or suspended? How will you debug Java threading issues?

1. It has been put to sleep for a set amount of time

 
   public void run(){
       try{
           while(true){
               this.sleep(1000);
               System.out.println("looping while");
            }
        }catch(InterruptedException ie){
        ie.printStackTrace();
  }
   }


2. The thread is suspended by call to wait( ), and will become runnable on a notify or notifyAll message.

 
class ConsumerProducer {

   private int count;
  
   public synchronized  void consume() {
       while(count == 0) {
          try {
        wait();
    }
     catch(InterruptedException ie){}
       }
       count--;   //consumed     
   }   


   public synchronized void produce() {
         count++;
   notify(); //notify the waiting consumer that count is incremented 
   }
   
}


3. Using join( ) method, which means waiting for a thread to complete. In the example below, the main thread that spawned worker threads t1 and t2 will wait on the t1.join() line until t1 has finished its work, and then will do the same for t2.join( ).

 
    Thread t1 = new Thread(new EventThread("event-1"));
    t1.start();
    Thread t2 = new Thread(new EventThread("event-2"));
    t2.start();

    while (true) {
        try {
           t1.join();
           t2.join();    
        }
        catch (InterruptedException e) {
            e.printStackTrace();
        }
     }


4. Threads will be blocked on acquiring an intrinsic or explicit lock. Understanding Java locks and synchronized keyword.

5. Threads can get blocked on a long running I/O operations. For example, on a call  to long running database operation.

Threads block on I/O so that other threads may execute whilst the I/O operation is being performed.

class MyServer implements Runnable {
  public void run() {
    try {
       ServerSocket ss = new ServerSocket(PORT);
       while (!Thread.interrupted()){
           new Thread(new Handler(ss.accept())).start();
           // one thread per socket connection
           // every thread created this way will essentially block for I/O
   }
   } catch (IOException ex) { 
      ex.printStacktrace();
   }
 }
 
   //...
}


In Java 5 NIO (New I/O) was introduced to perform non-blocking I/O with selectors and channels.

Q. How will you go about debugging threads that are blocked?
A. Creating thread dumps.Thread dumps are very useful for diagnosing synchronization problems such as blocked threads causing deadlocks, thread starvation, etc.
  • The trick is to take 5 or 6 sets of thread dumps at an interval of 5 seconds between each to have a dump file that has 25 to 30 seconds worth of run time action. 
  • For thread dumps, use kill -3 in Unix and CTRL+BREAK in Windows. There are tools like Thread Dump Analyzer (TDA), Samurai, etc to derive useful information from the thread dumps to find where the problem is.
  • For example, Samurai colors idle threads in grey, blocked threads in red, and running threads in green. You must pay more attention to those red ones, as to why they are blocked for 5+ seconds.

Manually reviewing the code for any obvious thread-safety issues. There are static analysis tools like Sonar, ThreadCheck, etc for catching concurrency bugs at compile-time by analyzing their byte code.

List all possible causes and add extensive log statements and write test cases to prove or disprove your theories.

There are tools like JDB (i.e. Java DeBugger) where a “watch” can be set up on the suspected variable. When ever the application is modifying that variable, a thread dump will be printed.

There are dynamic analysis tools like jstack and JConsole, which is a JMX compliant GUI tool to get a thread dump on the fly. The JConsole GUI tool does have handy features like “detect deadlock” button to perform deadlock detection operations and ability to inspect the threads and objects in error states. Similar tools are available for other languages as well.

Labels: ,

Jun 26, 2014

Transaction management with Spring and JTA interview questions and answers

Q. What is a Transaction? What does setAutoCommit do?
A.  A transaction is a set of operations that should be completed as a unit. If one operation fails then all the other operations fail as well. For example if you transfer funds between two accounts there will be two operations in the set

1. Withdraw money from one account.
2. Deposit money into other account.

These two operations should be completed as a single unit. Otherwise your money will get lost if the withdrawal is successful and the deposit fails. There are four characteristics (ACID properties) for a Transaction.

Atomicity
Consistency
Isolation
Durability
All the individual operations should either complete or fail. The design of the transaction should update the database correctly. Prevents data being corrupted by concurrent access by two different sources. It keeps transactions isolated or separated from each other until they are finished. Ensures that the database is definitely updated once the Transaction is completed.
Transactions maintain data integrity. A transaction has a beginning and an end like everything else in life. The setAutocommit(….), commit( ) and rollback( ) are used for marking the transactions (known as transaction demarcation). When a connection is created, it is in auto-commit mode. This means that each individual SQL statement is treated as a transaction and will be automatically committed immediately after it is executed. The way to allow two or more statements to be grouped into a transaction is to disable auto-commit mode:

try{
    Connection myConnection = dataSource.getConnection();
 
    // set autoCommit to false
    myConnection.setAutoCommit(false);

    withdrawMoneyFromFirstAccount(.............);   //operation 1
    depositMoneyIntoSecondAccount(.............);   //operation 2
 
    myConnection .commit();
}
catch(Exception sqle){
  try{
     myConnection .rollback();
  }catch( Exception e){}
}
finally{
   try{
        if( conn != null) {
             conn.close();
        }
  } catch( Exception e) {}
}


The above code ensures that both operation 1 and operation 2 succeed or fail as an atomic unit and consequently leaves the database in a consistent state. Also, turning auto-commit off will provide better performance.

Q. What is transaction demarcation? What are the different ways of defining transactional boundaries?
A. Data Access Objects (DAO) are transactional objects. Each operation associated with CRUD operations like Create, Update and/or Delete operations should be associated with transactions. Transaction demarcation is the manner in which transaction boundaries are defined. There are two approaches for transaction demarcation.

There are 2 types of transaction demarcation

1. Declarative transaction demarcation
2.  Programmatic transaction demarcation

1. Declarative transaction demarcation:

The programmer declaratively specifies the transaction boundaries using transaction attributes for an EJB via ejb-jar.xml deployment descriptor.

Note: Spring framework has support for declarative transaction demarcation by specifying transaction attributes via Spring config files. If you choose Spring framework to mark the transaction boundaries, then you need to turn off transaction demarcation in your EJB by marking it as NotSupported.

Q. How are these declarative transactions know when to rollback?

EJBs: When the EJB container manages the transaction, it is automatically rolled back when a System Exception occurs. This is possible because the container can intercept “System Exception”. However, when an "Application Exception" occurs, the container does not intercept it and therefore leaves it to the code to roll back using ctx.setRollbackOnly() method.

Spring Framework: Transaction declaration format is:

PROPAGATION_NAME,ISOLATION_NAME,readOnly,timeout_NNNN,+CheckedException1,-CheckedException2

By default transactions are rolled-back on java.lang.RuntimeException. You can control when transactions are committed and rolled back with the “+” or “-“ prefixes in the exception declaration. “+” means commit on exception (You can even force it on RuntimeException) and “-” means rollback on exception. You can specify multiple rules for rollback as “,” separated.

For example:  Following declaration will rollback transactions on RunTime exceptions and MyCheckedException, which is a checked exception.

PROPAGATION_REQUIRED,-MyCheckedException

2.  Programmatic transaction demarcation:

The programmer is responsible for coding transaction logic as shown above. The application controls the transaction via an API like JDBC API, JTA API, Hibernate API etc. JDBC transactions are controlled using the java.sql.Connection object. There are two modes: auto-commit and manual commit. Following methods are provided in the JDBC API via non-XA java.sql.Connection class for programmatically controlling transactions:

public void setAutoCommit(boolean mode);
public boolean getAutoCommit();
public void commit();
public void rollback();


For XA-Connections use the following methods on javax.transaction.UserTransaction.

public void begin();
public void commit();
public void rollback();
public int getStatus();
public void setRollbackOnly();
public void setTransactionTimeOut(int)


Q. What support does Spring framework have for transaction management?
A.

1. Spring supports both global transactions across multiple transactional resources through JTA and resouce specific local transaction associated with a JDBC connection. It provides a consistent programming model to support both local and global transactions. You write your code once, and it can benefit from different transaction management strategies in different environmen.

2. Supports both declarative transaction management via AOP and programmatic transaction management with the Spring Framework transaction abstraction which can run over any underlying transaction infrastructure. With the preferred declarative model, developers typically write little or no code related to transaction management.

Step 1: Define your transaction manager in a Spring context file

<bean id="txnManager" class="org.springframework.jdbc.datasource.DataSourceTransactionManager"/>
..
<tx:annotation-driven transaction-manager="txnManager"/>


Step 2: In your business service layer that makes calls to a number of daos, annotate to define your transaction demarcation

@Transactional
public int addUser(User user) {
    ...
}


The @Transactional annotation takes propagation and isolation levels as attributes, and the defaults being Propagation : Required and Isolation level : Default.

3. Spring framework has support for most transactional APIs such as JDBC, Hibernate, JPA, JDO, JTA etc. All you need to do is use proper transaction manager implementation class. For example org.springframework.jdbc.datasource.DriverManagerDataSource for JDBC transaction management and org.springframework.orm.hibernate3.HibernateTransactionManager for Hibernate as ORM tool.

4. The support for programmatic transaction management is provided via TransactionTemplate or PlatformTransactionManager implementation.

private PlatformTransactionManager txnManager;

public int addUser(User user) {
  TransactionDefinition transactionDefinition = new DefaultTransactionDefinition();
  TransactionStatus status = transactionManager.getTransaction(transactionDefinition);
  
   try{
      //....transactional operations
   
   transactionManager.commit(status);
   }
   catch(Exception ex){
      transactionManager.rollback(status);
   }
  
}


The Transaction Definition object encapsulates the transactional properties such as the isolation level, propagation behavior, timeout etc. The Transaction Status object represents the status of the executing transaction whether it is in new, completed, etc.

Q. What is a distributed (aka JTA/XA) transaction? How does it differ from a local transaction?
A. There are two types of transactions:

Local transaction: Transaction is within the same database. As we have seen above, with JDBC transaction demarcation, you can combine multiple SQL statements into a single transaction, but the transactional scope is limited to a single database connection. A JDBC transaction cannot span multiple databases.

Distributed Transaction (aka Global Transaction, JTA/XA transaction): The transactions that constitute a distributed transaction might be in the same database, but more typically are in different databases and often in different locations. For example, A distributed transaction might consist of money being transferred from an account in one bank to an account in another bank. You would not want either transaction committed without assurance that both will complete successfully. The Java Transaction API (JTA) and its sibling Java Transaction Service (JTS), provide distributed transaction services for the JEE platform. A distributed transaction (aka JTA/XA transaction) involves a transaction manager and one or more resource managers. A resource manager represents any kind of data store. The transaction manager is responsible for coordinating communication between your application and all the resource managers. A transaction manager decides whether to commit or rollback at the end of the transaction in a distributed system. A resource manager is responsible for controlling of accessing the common resources in the distributed system.

Q. What is two-phase commit?
A.  two-phase commit is an approach for committing a distributed transaction in 2 phases.

Q. What do you understand by JTA and JTS?
A. JTA is a high level transaction interface which allows transaction demarcation in a manner that is independent of the transaction manager implementation. JTS specifies the implementation of a Transaction Manager which supports the JTA. The code developed by developers does not call the JTS methods directly, but only invokes the JTA methods. The JTA internally invokes the JTS routines.

Q. What is a XA resource?
A. The XA specification defines how an application program uses a transaction manager to coordinate distributed transactions across multiple resource managers. Any resource manager that adheres to XA specification can participate in a transaction coordinated by an XA-compliant transaction manager.


JTA transaction demarcation requires a JDBC driver that implements XA interfaces like javax.sql.XADatasource, javax.sql.XAConnection and javax.sql.XAResource. A driver that implements these interfaces will be able to participate in JTA transactions. You will also require to set up the XADatasource using your application server specific configuration files, but once you get a handle on the DataSource via JNDI lookup, you can get a XA connection via javax.sql.DataSource.getConnection() in a similar manner you get a non-XA connections. XA connections are different from non-XA connections and do not support JDBC’s auto-commit feature. You cannot also use the commit( ), rollback( ) methods on the java.sql.Connection class for the XA connections. A J2EE component can begin a transaction programmatically using javax.transaction.UserTransaction interface or it can also be started declaratively by the EJB container if an EJB bean uses container managed transaction. For explicit (i.e. programmatic) JTA/XA transaction you should use the UserTransaction.begin( ), UserTransaction.commit() and UserTransaction.rollback() methods. For example:

// programmatic JTA transaction
InitialContext ctx = new InitialContext();
UserTransaction utx = (UserTransaction)ctx.lookup(“java:comp/UserTransaction”);

try { 
    //…
    utx.begin();
    //….
    DataSource ds = getXADatasource();
    Connection con = ds.getConnection(); // get a XAconnection.
    PreparedStatement pstmt = con.prepareStatement(“UPDATE Employee emp where emp.id =?”);
    pstmt.setInt(1, 12456);
    pstmt.executeUpdate(); 
    
   utx.commit();//transaction manager uses two-phase commit protocol to end transaction  
}
catch(SQLException sqle){
    utx.rollback();
    throw new RuntimeException(sqle);
}


Q. Why JTA transactions are more powerful than JDBC transactions?
A. JTA transactions are more powerful than JDBC transactions because a JDBC transaction is limited to a single database whereas a JTA transaction can have multiple participants like:
  • JDBC connections.
  • JMS queues/topics.
  • Enterprise JavaBeans (EJBs).
  • Resource adapters that comply with JEE Connector Architecture  (JCA) specification.  

Labels: , , ,

Jun 25, 2014

What is the difference between strategy and command design patterns?

Many design patterns look similar, but there are subtle differences as I explained the differences between Proxy, Decorator, Adapter, Bridge, and Facade design patterns Why do Proxy, Decorator, Adapter, Bridge, and Facade design patterns look very similar? What are the differences? In this post, let's compare strategy and command patterns.

Q. What is the difference between a strategy and a command pattern?
A. Firstly, some example

Strategy - quicksort or mergesort, simple vs compound interest calculations, etc
Command - Open or Close actions, redo or undo actions, etc. You need to know the states undo.


Strategy:

public interface AbstractStrategy {
     abstract void execute(Object arg);
}


public class ConcreteStrategy implements AbstractStrategy {

    @Override
    public void execute(Object arg) {
        // Work with passed-in argument.
    }

}


Command:

public interface AbstractCommand {
     abstract void execute();
}


public class ConcreteCommand implements AbstractCommand {

    private Object arg;

    public ConcreteCommand(Object arg) {
        this.arg = arg;
    }

    @Override
    public void execute() {
        // Work with own state.
    }

}


Q. Can you spot the subtle differences?
A.
  1. Strategy handles how something should be done by taking the supplied arguments in the execute(....) method. For example simple and compound interest will be different classes like SimpleInterestStrategy and CompoundInterestStrategy with different algorithms. Command creates an object out of what needs to be done (i.e. hold state) so that these command objects can be passed around between other classes. The actions the command represent can be undone or redone by maintaining the state. There will tend to be a large number of distinct Command objects that pass through your application.
  2. Design patterns provide a common vocabulary among the designers and developers. So, by looking at the classes and interfaces suffixed with Strategy and Command, the designers and users will understand the intent (i.e. point 1)


Command design pattern example:

Here is an example where requests are batched and then either committed as a batch or if an exception is thrown, rolled back as a batch. 2 types of command objects are used to increment and decrement the count of number of requests added to a batch. Both these command objects maintain the count via the CountState object.

Step 1: The interface for the command objects.

public interface AbstractCommand {
    abstract void execute();
    abstract void undo();
}


Step 2: A POJO object to store count data.

public final class CountState {

  private int count;
  
  public void increment(){
   ++this.count;
  }
  
  public void decrement() {
   --this.count;
  }
  
  public int getCount() {
   return this.count;
  }
}


Step 3: Increment and Decrement command objects

public class IncrementCommand implements AbstractCommand {

 private CountState count;
 
 public IncrementCommand(CountState count) {
  this.count = count;
 }

 private String previousString;

 @Override
 public void execute() {
  count.increment();
  
 }

 @Override
 public void undo() {
  count.decrement();
 }
 
}


public class DecrementCommand implements AbstractCommand {

 private CountState count;
 
 public DecrementCommand(CountState count) {
  this.count = count;
 }

 private String previousString;

 @Override
 public void execute() {
  count.decrement();
  
 }

 @Override
 public void undo() {
  count.increment();
 }
 
}


Step 4: Now, the request processor class that is responsible for adding batching requests via addRequest() or removeRequest() methods and batch execution or rollback via commitBatch() and rollbackBatch() methods. This makes makes use of the command objects.

import java.util.ArrayDeque;
import java.util.Deque;
import java.util.HashMap;
import java.util.Map;

public class RequestProcessor {

 private Deque<AbstractCommand> commandStack = null;
 private AbstractCommand incCmd;
 private AbstractCommand decCmd;

 private Map<String, String> requestCollection = new HashMap<>();

 public RequestProcessor(AbstractCommand incCmd, AbstractCommand decCmd) {
  this.commandStack = new ArrayDeque<>();
  this.incCmd = incCmd;
  this.decCmd = decCmd;
 }

 public void addRequest(String requestId, String requestTxt) {
  incCmd.execute();
  commandStack.push(incCmd);
  requestCollection.put(requestId, requestTxt);
 }

 public void removeRequest(String requestId) {
  decCmd.execute();
  commandStack.push(decCmd);
  requestCollection.remove(requestId);
 }

 public void commitBatch() {
  // ...logic to action all the requests
  // left out for brevity
  requestCollection.clear();
  this.commandStack = new ArrayDeque<>();
 }

 public void rollbackBatch() {
  AbstractCommand cmd = null;
  while (!commandStack.isEmpty()) {
   cmd = commandStack.pop();
   cmd.undo();
  }
 }
}


Finally, the client app that makes use of the RequestProcessor and other objects.

public class ClientApp {

 public static void main(String[] args) {
  CountState state = new CountState();
  AbstractCommand incCmd = new IncrementCommand(state);
  AbstractCommand decCmd = new DecrementCommand(state);
  RequestProcessor processor = new RequestProcessor(incCmd, decCmd);

  processor.addRequest("1", "productcode:123, price:25.50");
  processor.addRequest("2", "productcode:456, price:12.50");
  processor.addRequest("3", "productcode:789, price:14.50");

  // ...

  processor.removeRequest("3");

  try {

   processor.commitBatch();
   System.out.println("number of requests processed:" + state.getCount()); // 2
   throw new RuntimeException();

  } catch (Exception ex) {
   processor.rollbackBatch();
   System.out.println("number of requests processed:" + state.getCount()); // 0
  }
 }
}


The strategy deign pattern example is covered in Java design pattern interview questions and answers: strategy and factory pattern

Labels: ,

Jun 17, 2014

What are the 16 technical key areas of Java programming and how will they help you fast-track your Java career as a developer?

What are the 16 technical key areas?


  1. Language Fundamentals (LF)
  2. Specification Fundamentals (SF)
  3. Platform Fundamentals (PF)
  4. Design Considerations  (DC)
  5. Design Patterns (DP)
  6. Concurrency Management (CM)
  7. Performance Considerations  (PC)
  8. Memory/Resource Considerations  (MC)
  9. Transaction Management  (TM)
  10. Security (SE)
  11. Scalability  (SC)
  12. Best Practices (BP)
  13. Coding (CO)
  14. Exception Handling (EH)
  15. Software Development Processes (SDP)
  16. Quality of Service  (QoS)


Why will they help you fast-track your career?
  1. I am yet to work for an organization that didn't face challenges relating to performance, memory, security, scalability, and concurrency. When you have production issues relating to these key areas, the middle to senior management will be constantly monitoring progress through regular crisis meetings. Having a good handle on these key areas to solve issues will put you on the good books with the management. 


  2. Technical job interviews are conducted by senior/lead developers and  architects. The above key areas are their favorite topics, and you can get open ended questions, which have no right or wrong answers, but you can really show off your  technical and communication skills with the quality of the answers you provide. Here are some popular open-ended questions

    • Can you describe the architecture of the last application you had worked on from a 100 feet?
    • How would you go about designing an online shopping cart application in .Net?
    • Can describe some of the common mistakes and pitfalls of C#? What features do you like and dislike? What features do you like to be added in the future releases?
    • If you are reviewing others' code, what would you look for?
    • What do you like the most about your current job?
    • How do you ensure code quality within your team?
    • What is a deadlock, and how will you go about detecting and fixing a deadlock?
    • Can you describe a situation where you fixed a transaction management or a concurrency issue?


  3. When you are asked the very common ice breaker interview question "tell me about yourself?"  you can highlight your strengths in the technical key areas, and also for other questions like "what are your strengths?", "why should we hire you?", etc you can bring out your strengths in these key areas with examples. Towards the end of the interviews, you will be asked  -- "Do you have any questions for us?". If you feel that you have not sold your key strengths as well as you would have liked, take this question as an opportunity to ask your interviewers the questions like -- What kind of developers succeed in your organization?, Do you think that hands-on experience in writing low latency applications and ability to identify and fix performance and concurrency issues will be handy?, Do you have any reservations about any areas of my abilities to get the job done?, etc to give yourself a chance to sell your strengths and  leave the interview with a good impression.


  4. In code review sessions to impress your superiors and peers. I improved my coding skills by reviewing others' quality code, and also learned what not to do from others' bad code. Having a good handle on the above technical key areas like best practices, language and specification fundamentals, coding, exception handling, quality of service, scalability, etc will help you write robust code.


  5. These key areas will help you contribute in your team meetings.  All your contributions will be noticed for potential promotions and pay rises.


  6. Good engineers ask the right questions like 

    • If an exception gets thrown here, will my transaction get rolled-back  properly?
    • Will this regular expression gets back tracked, and adversely impact performance?
    • Do I have proper service timeouts and retries implemented properly for web service calls?
    • Should I have dead lock retry here?
    • Should I go for optimistic or pessimistic locking?


    This is also a part of the answer for the question -- Why do you like software engineering? Good software engineers like to see all these 16 technical key areas fit together like a jig saw puzzle to build a quality application.


  7. Knowledge, skills, and experience gained in these key areas are transferable from one programming language to another. So, these are transferable skills. 


How do you go about getting a good handle on these key areas?

Proactively pick a  key area that you have less experience with and learn about it relating to your mainstream language. Write some sample code. Examine others' code in your work to see how it was applied. Find a way in which you can apply it in your current project. Blog about it in your own style. Add it to your resume.

In short, Learn --> Apply --> Let the world know

Labels:

Jan 18, 2013

Identifying Java concurrency issues -- thread starvation, dead lock, and contention


Concurrency is very important in any modern system, and this is one topic many software engineers struggle to have a good grasp. The complexity in concurrency programming stems from the fact that the threads often need to operate on the common data. Each thread has its own sequence of execution, but accesses common data.


Debugging concurrency issues and fixing any thread starvation, dead lock, and contention require skills and experience to identify and reproduce these hard to resolve issues. Here are some techniques to detect concurrency issues.

  • Manually reviewing the code for any obvious thread-safety issues. There are static analysis tools like Sonar, ThreadCheck, etc for catching concurrency bugs at compile-time by analyzing their byte code.
  • List all possible causes and add extensive log statements and write test cases to prove or disprove your theories.
  • Thread dumps are very useful for diagnosing synchronization problems such as deadlocks. The trick is to take 5 or 6 sets of thread dumps at an interval of 5 seconds between each to have a log file that has 25 to 30 seconds worth of runtime action. For thread dumps, use kill -3 in Unix and CTRL+BREAK in Windows. There are tools like Thread Dump Analyzer (TDA), Samurai, etc. to derive useful information from the thread dumps to find where the problem is. For example, Samurai colors idle threads in grey, blocked threads in red, and running threads in green. You must pay more attention to those red threads.
  • There are tools like JDB (i.e. Java DeBugger) where a “watch” can be set up on the suspected variable. When ever the application is modifying that variable, a thread dump will be printed.
  • There are dynamic analysis tools like jstack and JConsole, which is a JMX compliant GUI tool to get a thread dump on the fly. The JConsole GUI tool does have handy features like “detect deadlock” button to perform deadlock detection operations and ability to inspect the threads and objects in error states. Similar tools are available for other languages as well.

Here are some best practices to keep in mind relating to writing concurrent programs.

  • Favor immutable objects as they are inherently thread-safe.
  • If you need to use mutable objects, and share them among threads, then a key element of thread-safety is locking access to shared data while it is being operated on by a thread. For example, in Java you can use the synchronized keyword.
  • Generally try to keep your locking for as shorter duration as possible to minimize any thread contention issues if you have many threads running. Putting a big, fat lock right at the start of the function and unlocking it at the end of the function is useful on functions that are rarely called, but can adversely impact performance on frequently called functions. Putting one or many larger locks in the function around the data that actually need protection is a finer grained approach that works better than the coarse grained approach, especially when there are only a few places in the function that actually need protection and there are larger areas that are thread-safe and can be carried out concurrently.
  • Use proven concurrency libraries (e.g. java.util.concurrency) as opposed to writing your own. Well written concurrency libraries provide concurrent access to reads, while restricting concurrent writes.


Fixing production issues

There could be general run time production issues that either slow down or make a system to hang. In these situations, the general approach for troubleshooting would be to analyze the thread dumps to isolate the threads which are causing the slow-down or hang. For example, a Java thread dump gives you a snapshot of all threads running inside a Java Virtual Machine. There are graphical tools like Samurai to help you analyze the thread dumps more effectively.


  • Application seems to consume 100% CPU and throughput has drastically reduced – Get a series of thread dumps, say 7 to 10 at a particular interval, say 5 -8 seconds and analyze these thread dumps by inspecting closely the “runnable” threads to ensure that if a particular thread is progressing well. If a particular thread is executing the same method through all the thread dumps, then that particular method could be the root cause. You can now continue your investigation by inspecting the code.

  • Application consumes very less CPU and response times are very poor due to heavy I/O operations like file or database read/write operations – Get a series of thread dumps and inspect for threads that are in “blocked” status. This analysis can also be used for situations where the application server hangs due to running out of all runnable threads due to a deadlock or a thread is holding a lock on an object and never returns it while other threads are waiting for the same lock.
The solution to the above problems could vastly vary from fixing the thread safety issue(s) to reducing the size of synchronization granularity, and from implementing appropriate caching strategies to setting the appropriate connection timeouts, and other reasons discussed in the last section.


You may also like:

Labels:

Oct 24, 2012

Caching Data in Java and LRU strategy


Q. What is the purpose of using a cache?
A. A cache is an area of local memory that holds a copy of frequently accessed data that is otherwise expensive to get or compute. Examples of such data include a result of a query to a database, a disk file or a report. Caching is used primarily for performance and scalability. It is a mechanism by which subsequent requests for the data are served faster.

Avoid the anti-pattern or pitfall of "Cache Them All", and cache only the data that is hard to get.

Q. What are some of the requirements you need to consider when writing your own cache or using a cacheing framework like EHCache, OSCache, etc?
A.
  1. The cache needs to have some boundary conditions defined to limit the memory usage. Each item in the cache can consume unbounded amounts of memory, hence the cache should hold its values using WeakReferences, which makes it possible for the cache to evict entries when memory is short, even when the cache is not full or the boundary conditions are not met.
  2. You need to have a replacement algorithm to purge entries from a cache when the boundary conditions are reached.  For example, reaching the maximum number of entries allowed. One such algorithm  is LRU (Least Recently Used). In this algorithm cache entries which have not been accessed recently will be replaced. If you are writing your own cache, one approach is to maintain  a timestamp at which the entry was inserted and select the entry with the oldest timestamp to be removed. But this search would be linear taking O(N) time. A more efficient approach would be to maintain the entries in a sorted collection based on the order in which the entries were accessed. Alternatively, you can use a doubly linked list where the items that are accessed via the cache are moved towards the end of the list, and purging of the entries in the cache are done from the front of the list.  
  3. Some caches need to be regularly refreshed to prevent them from becoming stale. This can be accomplished by adding an expiry timestamp. 
  4. If you are writing your own caching mechanism, then the cache item insertion and lookup operations need to be fast preferably O(1) time. This means a HashMap will be a potential candidate. The cached data can be accessed concurrently, hence a ConcurrentHashMap or a SynchronizedMap will be a good candidate. The cache should not be locked when an entry is searched, and only the searched entry should be locked. In the scenario where multiple threads search for the same key, the computation of the key value should be performed only once.


So, this is why you need to apply the "don't reinvent the wheel" principle and favor utilizing a proven and tested caching frameworks like EHCache that takes care of better memory management with LRU and FIFO eviction strategies, disk overflow, data expiration and many other optional advanced features, as opposed to writing your own. Having said this, there are cases where you might want to write your own simple caching solution or you might be asked in job interviews with questions like -- How will you implement an LRU cache in Java?

This is is very similar to the question, if Java did not have a HashMap class, how will you go about implementing your own? This was discussed with the answer and key considerations in the book "Core Java Career Esentials"


Q. What are the differences between HashMap, TreeMap (i.e. SortedMap), and a LinkedHashMap?
A. All three classes implement the Map interface and offer mostly the same functionality. The differences are in how the entries are iterated through

  • HashMap does not offer any guarantees about the iteration order. Its iteration order can change completely when new elements are added.
  • TreeMap will iterate according to the "natural ordering" of the keys according to their compareTo( ) method or based on an externally supplied Comparator. Additionally, it implements the SortedMap interface, which contains methods that depend on this sort order.
  • LinkedHashMap will iterate in the order in which the entries were put into the map.  The LinkedHashMap also provides a great starting point for creating a LRU Cache by overriding the removeEldestEntry( ) method. This lets you create a Cache that can expire data using some criteria that you define.

Q. What are the different types of algorithms that can be used to remove objects from the cache?
A. A variety of cache expiration mechanisms can remove objects from a cache. These algorithms are based on criteria such as least frequently used (LFU), least recently used (LRU), most recently used (MRU), first in first out (FIFO), last access time, and object size. Each algorithm has advantages and disadvantages. So, analyse your requirements and choose the most appropriate one.

In enterprise applications, object caching in a cluster is important because multiple JVMs run in a cluster, and it is crucial to keep all the cluster members' cached data in sync.


Q. How will you implement an LRU cache in Java?
A. Here is the sample code in Java

Firstly, define an interface so that the implementation can be changed  if for example,  in future you have a ConcurrentLinkedHashMap class.  A typical interface for a Java cache will look like

public interface LRUCache<K,V> {
   public abstract V put(K key, V item);
   public abstract V get(K key);
   public abstract V atomicGetAndSet(K key, V item); 
}


Now, the implementation class.

import java.lang.ref.SoftReference;
import java.util.LinkedHashMap;
import java.util.Map;

public class LRUCacheImpl<K, V> implements LRUCache<K, V> {

 //SoftReference is used for a memory friendly cache. 
 //the value will be removed under memory shortage situations and 
 //the keys of the values will be removed from the cache map. 
 private final Map<K, SoftReference<V>> cache;

 
 public LRUCacheImpl(final int cacheSize) {

  // 'true'  uses the access order instead of the insertion order.
  this.cache = new LinkedHashMap<K, SoftReference<V>> (cacheSize, 0.75f, true) {
   
   private static final long serialVersionUID = 1L;

   @Override
   protected boolean removeEldestEntry(Map.Entry<K, SoftReference<V>> eldest) {
    // When to remove the eldest entry i.e Least Recently Used (i.e LRU) entry
    return size() > cacheSize; // Size exceeded the max allowed.
   }
  };
 }

 @Override
 public V put(K key, V value) {
    SoftReference<V> previousValueReference = cache.put(key, new SoftReference<V>(value));
    return previousValueReference != null ? previousValueReference.get() : null;
 }

 @Override
 public V get(K key) {
     SoftReference<V> valueReference = cache.get(key);
     return valueReference != null ? valueReference.get() : null;
 }

 @Override
 public V atomicGetAndSet(K key, V value) {
    V result = get(key);
    put(key, value);
    return result;
 }

}


Here some key points on the above code that are worthy of mentioning not only in the job interviews to stand out from your competition, but also to write quality code and get thumbs up in the code reviews.

  1. The above code would have been written as  LRUCacheImpl<K, V>extends LinkedHashMap<K, V>, but the GoF design pattern favors composition over inheritance as inheritance is more fragile to changes.
  2. SoftReference is  used as opposed to the hard reference, to force the items to be garbage collected when the Java heap runs low in memory.
  3. The methods are synchronized to be thread-safe. In future, if a ConcurrentLinkedHashMap were to be added, then it can be used instead the LinkedHashMap.
  4. If performance is of utmost importance is of utmost importance, then the public V get(K key)  method can be executed asynchrously via a thread pool as this method will get frequently executed.

Q. What are the different types of caches?
A. There are different types of caches
  • An application cache is a cache that an application accesses directly. An application benefits from using a cache by keeping most frequently accessed data in memory. This is also known as the first level cache. For example, Hibernate can use EHCache, OSCache, SwarmCache, or JBoss TreeCache as its first level cache.
  • Level 2 (aka L2) cache  provides caching services to an object-relational mapping (ORM) framework or a data mapping (DM) framework such as Hibernate or iBatis respectively by reducing the number of trips to the database. An L2 cache hides the complexity of the caching logic from an application.
  • In memory Data Grids/Clouds for distributed caching with powerful analysis and management tools to give you a complete solution for managing fast-changing data in multiple servers, compute grid, or in the cloud. For example, Apache Hadoop, GridGain, Oracle Cherence, etc. A data grid is a reliable distrbuted cache that uses an external data source to retrieve data that is not present in the cache and an external data store to write the updates. In simple terms, grid or cloud computing is all about setting up an HTTP server to farm out requests RESTfully, and accept responses the same way. You can also use messaging with JMS, RMI or even the old-school Corba. But why reinvent the wheel when there are open-source frameworks like Hadoop, GridGain, Hazelcast, etc. 

Q. Will WeakHashMap make a good cache? Explain your answer?
A. No. There are 2 reasons for it.

  1.  It uses weak references as the underlying memory management mechanism. If the garbage collector determines that an object is weakly reachable, it will clear atomically all weak references to the object., whereas if the garbage collector determines that an object is softly reachable (i.e. uses a soft reference as opposed to a weak refrence), it may clear atomically all soft references to the object, in the case that it finds that memory is running low, or at its own discretion.
  2. In a WeakHashMap, the weak references are used for the keys and not for the values. You want the map values to use a weaker reference.


Q. Where would you use a WeakHashMap ?
A. It is good to implement canonical maps where you can associate some extra information to an object that you have a strong reference to. You put an entry in a WeakHashMap with the object as the key, and the extra information as the map value. This means, as long as you keep a strong reference to the object, you will be able to check the map to retrieve the extra information, and once you release the object, the map entry will be cleared and the memory used by the extra information will be released.

Labels:

May 16, 2012

Memory leak in Java


Q. How will you go about creating a memory leak in Java?
A. In Java, memory leaks are possible under a number of scenarios. Here is a typical example where hashCode( ) and equals( ) methods are not implemented for the Key class that is used to store key/value pairs in a HashMap. This will end up creating a large number of duplicate objects. All memory leaks in Java end up with java.lang.OutOfMemoryError, and it is a matter of time. The following code agressively creates the OutOfMemoryError via an endless loop for demonstration purpose.

If you are not familiar with the significance of equals( ) and hashCode ( ) methods in Java learn how to define proper key class in Java.

import java.util.HashMap;
import java.util.Map;

public class MemoryLeak {

 public static void main(String[] args) {
  Map<Key, String> map = new HashMap<Key, String>(1000);
  
  int counter = 0;
  while (true) {
       // creates duplicate objects due to bad Key class
   map.put(new Key("dummyKey"), "value");
   counter++;
   if (counter % 1000 == 0) {
    System.out.println("map size: " + map.size());
    System.out.println("Free memory after count " + counter
      + " is " + getFreeMemory() + "MB");
      
    sleep(1000);
   }
   
   
  }
 }

 // inner class key without hashcode() or equals() -- bad implementation
 static class Key {
  private String key;

  public Key(String key) {
   this.key = key;
  }

 }

 //delay for a given period in milli seconds
 public static void sleep(long sleepFor) {
  try {
   Thread.sleep(sleepFor);
  } catch (InterruptedException e) {
   e.printStackTrace();
  }
 }

 //get available memory in MB
 public static long getFreeMemory() {
  return Runtime.getRuntime().freeMemory() / (1024 * 1024);
 }

}

If you run the above code, you will get the ouput as shown below

map size: 1000
Free memory after count 1000 is 4MB
map size: 2000
Free memory after count 2000 is 4MB
map size: 1396000
Free memory after count 1396000 is 2MB
map size: 1397000
Free memory after count 1397000 is 2MB
map size: 1398000
Free memory after count 1398000 is 2MB
map size: 1399000
Free memory after count 1399000 is 1MB
map size: 1400000
Free memory after count 1400000 is 1MB
map size: 1401000
Free memory after count 1401000 is 1MB
.....
.....
map size: 1452000
Free memory after count 1452000 is 0MB
map size: 1453000
Free memory after count 1453000 is 0MB
Exception in thread "main" java.lang.OutOfMemoryError: Java heap space
 at java.util.HashMap.addEntry(HashMap.java:753)
 at java.util.HashMap.put(HashMap.java:385)
 at MemoryLeak.main(MemoryLeak.java:10)


As you could see, the size of the map keeps growing with the same objects and the available memory keeps coming down from 4MB to 0MB. At the end, the program dies with an OutOfMemoryError.


Q. How will you fix the above memory leak?
A. By providing proper implentation for the key class as shown below with the equals() and hashCode() methods.

    .....
 static class Key {
  private String key;

  public Key(String key) {
   this.key = key;
  }

 
  @Override
  public boolean equals(Object obj) {

   if (obj instanceof Key)
    return key.equals(((Key) obj).key);
   else
    return false;

  }

  @Override
  public int hashCode() {
   return key.hashCode();
  }
 }
 .....
 
If you rerun it after making the fix shown above to the MemoryLeak class, you will get an output as shown below. The program runs endlessly, and creates only one object in the HashMap.

map size: 1
Free memory after count 1000 is 4MB
map size: 1
Free memory after count 2000 is 4MB
map size: 1
Free memory after count 3000 is 4MB
map size: 1
Free memory after count 4000 is 4MB
...
Free memory after count 73000 is 4MB
map size: 1
Free memory after count 74000 is 4MB
map size: 1
Free memory after count 75000 is 4MB

Q. In real applications, how do you know that you have a memory leak?
A. If you profile your application, you can notice a graph like a saw tooth. Here is how you can determine this with the help of jconsole for the above bad key class example. All you have to to do is while your MemoryLeak is running, get the Java process id by typing

C:\>jps
5808 Jps
4568 MemoryLeak
3860 Main

Now, open up the jconsole as shown below on a command line
 
C:\>jconsole 4568

If try this for both good key class and the bad key class you will get the memory graphs as shown below.

No memory Leak: 


With Memory Leak (saw tooth graph):


You can learn more about profiling


Labels:

May 15, 2012

Java memory profiling questions and asnwers

The questions and answers on Java performance and CPU profiling was discussed in a separate blog. This blog covers memory profiling. Try this blog entry if you want to know how to create memory leak in Java.

Q. How will you go about profiling your Java application for memory usage?
A. There are number of tools both commercial and open-source. There are command line tools that get shipped with Java like hprof, jconsole, jhat, and jmap. Here is an example with hprof.


java -agentlib:hprof=heap=all,thread=y,format=b test.ProfilingTest

When you run the above command in binary format (i.e. format=b), it produces a heap dump file called “java.hprof” when the program exits or a control character (Ctrl-\ or Ctrl-Break on WIN32 and QUIT signal is received kill -QUIT  on Unix machines) is pressed, which can be opened in eclipse memory analysis tool (MAT) for further analysis and leak detection.


A Java heap dump is an image of the complete Java object graph at a certain point in time. It includes all objects, fields, primitive types and object references. It is possible to instruct the JVM to create a heap dump automatically in case of a OutOfMemoryError with the JVM option -XX:+HeapDumpOnOutOfMemoryError. You could also dump the heap on ctrl+brk key stroke by setting the JVM argument -XX:+HeapDumpOnCtrlBreak.


The above heap dump can also be analyzed instantly with the jhat tool that is shipped with your java.

jhat java.hprof


The above command starts a web server as shown below
Reading from java.hprof...
Dump file created Mon Nov 21 12:52:22 EST 2011
Snapshot read, resolving...
Resolving 5426 objects...
Chasing references, expect 1 dots.
Eliminating duplicate references.
Snapshot resolved.
Started HTTP server on port 7000
Server is ready.


The report can be viewed via an internet browser using http://localhost:7000


The “jmap” and jconsole are handy tools for analyzing heaps and garbage collection respectively. If you start your application with the following command line options, you will have a number of options to gather profiling data in Java.

  java -Dcom.sun.management.jmxremote -Dcom.sun.management.jmxremote.port=9000 \
       -Dcom.sun.management.jmxremote.authenticate=false \
       -Dcom.sun.management.jmxremote.ssl=false \
       -agentlib:hprof=heap=dump, format=b,depth=10 test.ProfilingTest


If you type jconsole on a command line, you will get the following console.


The “4564” is the process id of the Java process. You can also find out the process id by typing “jps” on a command line.


Click on the connect button to view the different profiles as shown below. The jconsole has a button to invoke the garbage collection at your will along with other useful profiling information.


The “jmap” is a handy utility that will cause the heap dump of a running Java application. Find out the process id <pid> with the following command

jps 

and then run the jmap command as shown below with the relevant Java process id (e.g. 4564).


jmap -dump:format=b,file=hprof.bin 4564

 The heap dump file hprof.bin can be opened with jhat and eclipse memory analysis tool for further analysis.

There are commercial tools that can be used in production environment like YourKit for Java & .Net, JProfiler for Java, etc to tools for larger distributed and clustered systems with large number of nodes like CA Wiley Introscope for Java and .Net, SiteScope from HP and ClearStone for Java.

Labels:

May 8, 2012

Java performance questions and answers: overview and profiling cpu

Q. When somebody says an application is running "very slow, what does he/she mean?
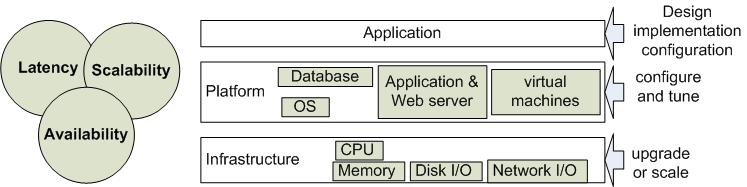
A. He/she is generally referring to one of two performance attributes –  latency or scalability. Latency describes how long it takes for a given task to complete, whereas scalability describes how a program's performance gets impacted under increasing load. Building high performance applications require 

  • Low latency –  for example,  low page loading times.
  • High scalability – for example, serving increasing number of users without adversely impacting performance. 
  • High availability – for example, staying up 24x7, without going down due to memory leak or running out of connections to the database or LDAP server.

As described in the above diagram, performance issues can occur due to a variety of reasons.  It can vary from a bad application, database, or infrastructure design that does not scale well to poorly tuned load balancer, virtual machine, application server, and from badly constructed SQL statements (e.g. a Cartesian join) and frequently back tracking regular expressions to thread contention issues caused by multiple threads simultaneously waiting for a long running locked method, block of code, or  database records. Memory and non-memory (e.g. sockets, connections, etc) leaks can also degrade performance by depriving your application of these scarce resources by either consuming more CPU cycles due to over working the garbage collection or by running out of memory or connections. 


Q. What tools do you need to profile a Java application?
A. For troubleshooting Java applications, there are basic tools like vmstat, hprof, JConsole, JAMon, PerfAnal, etc to more feature packed profiling tools like VisualVM, Netbeans profiler, eclipse TPTP (i.e. Test & Performance Tools Platform), etc to tools that can be used in production environment like YourKit for Java, JProfiler for Java, etc to tools for larger distributed and clustered systems with large number of nodes like CA Wiley Introscope for Java, HP Sitescope and ClearStone for Java.

Q. How would you go about profiling a Java application?
A. The following example uses an hprof tool that comes with Java to determine the cpu times. The profiles are dumped to “java.hprof.txt” file when the program exits or a control character Ctrl-\ or Ctrl-Break (WIN32) depending on platform is pressed. On Solaris OS and Linux a profile is also generated when a QUIT signal is received (kill -QUIT ). The process id can be determined with the “jps” command. The command shown below executes the "ProfilingTest" class with the hprof agent for measuring cpu times.

java -agentlib:hprof=cpu=times test.ProfilingTest 

The profiled results will be dumped to a file named “java.hprof.txt”.

CPU TIME (ms) BEGIN (total = 1953) Thu Sep 15 12:26:50 2011

rank  self    accum      count   trace      method
   1   51.20%  51.20%       1   301025   ProfilingTest.invokeMethod3
   2   31.23%  82.44%       1   301015   ProfilingTest.invokeMethod2
   3   15.21%  97.64%       1   301005   ProfilingTest.invokeMethod1
   4   0.82%   98.46%       1   300396   java.net.URLClassLoader$1.run
   5   0.77%   99.23%       2   300707   java.io.Win32FileSystem.normalize
   6   0.77%   100.00%    268   300309   java.lang.StringBuilder.append
CPU TIME (ms) END
 
PerfAnal is a GUI based analysis tool to analyze the above results.

java -jar PerfAnal.jar  java.hprof.txt


Similar approach can be used for profiling for memory usage.


Learn more -- Java Interview Questions and Answers - performance testing your Java application

Labels:

Apr 24, 2012

Java interview questions and answers on asynchronous processing

The scenario based questions are very popular with the job interviewers, and some scenario based questions are related to decoupling and asynchronous (aka non-blocking) processing. The interviewer will give you a scenario like producing an aggregate report,  designing a trading system, or building an application that requires heavy auditing, logging or custom metrics gathering. Feel free to ask the right questions as the interviewer will be more interested in how you think and approach a problem rather than you solve it instantly or not. 

Q. Can you describe instances where you used asynchronous processing in your application?
A. The asynchronous processing is very handy for decoupling systems and for boosting  performance and scalability. Here are a few examples.


Example 1:

An online application with a requirement to produce time consuming reports or a business process (e.g. rebalancing accounts, aggregating hierachical information, etc) could benefit from making these long running operations asynchronous. Once the reports or the long running business process is completed, the outcome can be communicated to the user via emails or asynchronously refreshing the web page via techniques known as "server push" or "client pull". A typical example would be

a)  A user makes a request for an aggregate report or a business process like rebalancing his/her portfolios. 
b)  The user input can be saved to a database table for a separate process to periodically pick it up and process it asynchronously.
c)  The user could now continue to perform other functionalities of the website without being blocked.
d)  A separate process running on the same machine or different machine can periodically scan the table for any entries and produce the necessary reports or execute the relevant business process. This could be a scheduled job that runs once during off-peak or every 10 minutes. This depends on the business requirement.
e)  Once the report or the process is completed, notify the user via emails or making the report available online to be downloaded.


Example 2:

If you are working in an online trading application, you may want the functionality to queue trades and process them when the stock market opens. You also asynchronously receive the order statuses like partially-filled, rejected, fully filled, etc from the stock market. The message oriented middlewares provide features like guaranteed delivery with store-and-forward mechanism, no duplicates, and transaction management for enterprise level program-to-program communications by sending and receiving messages asynchronously (or synchronously). The diagram below gives a big picture.


Example 3:

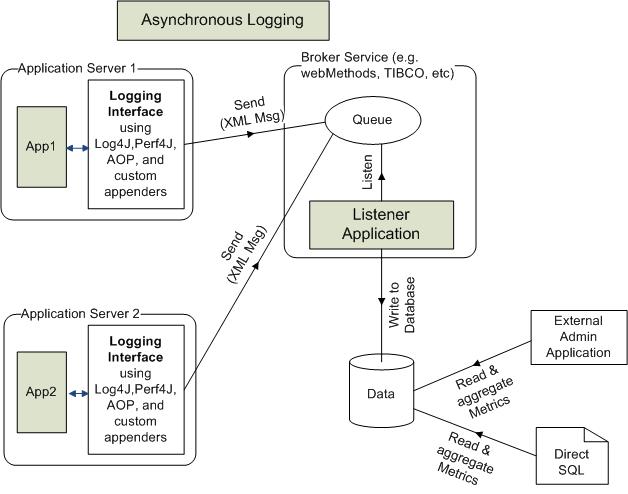
You may have a requirement for stringent logging, auditing or performance metrics gathering. Processing these non-functional requirements asynchronously and non-intrusively can make your system perform and scale better. For example, you could send the log messages to a queue to be processed later asynchronously by a separate process running on the same machine or a separate machine. The performance metrics can be processed asynchronously as well. here is a working example with relevant code snippets.


For example, a trading application may have a number of synchronous and asynchronous moving parts and metrics needs to be recorded for various operations like placing a trade on to a queue, receiving asynchronous responses from the stock market, correlating order ids, linking similar order ids, etc. A custom metrics gathering solution can be accomplished by logging the relevant metrics to a database and then running relevant aggregate queries or writing to a file system and then running PERL based text searches to aggregate the results to a “csv” based file to be opened and analyzed in a spreadsheet with graphs. In my view, writing to a database provides a greater flexibility. For example, in Java, the following approach can be used.


Step 1: Use log4j JMS appender or a custom JMS appender to send log messages to a queue. This ensures that your application's performance is not adversely impacted by logging activities by decoupling it.

Step 2: Use this appender in your application via Aspect Oriented Programming (AOP – e.g Spring AOP, AspectJ, etc) or dynamic proxy classes to non-intrusively log relevant metrics to a queue. It is worth looking at Perf4j and context based logging with MDC (Mapped Diagnostic Contexts) or NDC (Nested Diagnostic Contexts) to log on a per thread basis to correlate or link relevant operations. Perf4J is a great framework for performance logging. It's non-intrusive and really fills the need for accurate performance logging. The Perf4j provides features like a command line tool to generate aggregated results and graphs from raw log files, ability to expose performance statistics as JMX attributes and to send notifications when statistics exceed specified thresholds, custom log4j appenders, and AOP aspects that allow non obtrusive statements when used with Spring AOP.

The Perf4J is for

System.currentTimeMillis( );

as Log4J is for

System.out.println(.....);

Step 3: A stand-alone listener application needs to be developed to dequeue the performance metrics messages from the queue and write to a database or a file system for further analysis and reporting purpose. This listener could be written in Java as a JMX service using JMS or via broker service like webMethods, TIBCO, etc.

Step 4: Finally, relevant SQL or regular expression based queries can be written to aggregate and report relevant metrics in a customized way.

The data captured could be an Event object containing

private final String environment;           // source environment
private final Long timestamp;               // source timestamp
private final Long duration;                // sample duration
private final String thread;                // Log4j ThreadName
private final String component;             // component name 
private final Stage stage;                  // enum BEGIN | END | NONE
private final String source;                // Log4j LoggerName
private final String context;               // Log4j NDC
private final String process;               // work process 
private final String item;                  // work item identity (eg. orderId)
private final String level;                 // Log4j Level
private final String message;               // Log4j RenderedMessage
private final String exceptionMessage;      // Log4j Throwable Message
private final String exceptionStacktrace;   // Log4j Throwable Stacktrace


An XML based library like Xtream can be used to serialize and deserialize the messages. Here is some pseudo code in Java.

Let's look at some sample code:

STEP-1: Define the custom appender in Log4j. In Log4J, appenders are responsible for handling the output and transport of logging data ('output destinations'). There are appenders for writing log data to files, for logging over the network or to write the logging output to the terminal, just to name a few.


package com;

public class EventJmsXmlAppender extends AppenderSkeleton {
  ...
  public boolean requiresLayout( ) 
  {
    return true;
  }

  protected void append(LoggingEvent event) 
  {
    try
     {
       //construct and the send the log metrics event to JMS queue
       JMSServiceFactory jmsService = JMSServiceFactory.getJmsServiceFactory();
       QueueConnectionFactory qFactory = (QueueConnectionFactory)jmsService.getTargetJMSConnectionFactory("jms/LogConnectionFactory",  serviceLocator); 
       QueueConnection qConnection = qFactory.createQueueConnection();
       qSession qSession = qConnection.createqSession(false, Session.AUTO_ACKNOWLEDGE);
       Queue q =  (Queue)jmsService.getTargetJMSQueue("jms/EventsQueue", serviceLocator);
       QueueSender qSender = qSession.createSender(q);
       TextMessage msg =  qSession.createTextMessage();
       msg.setText(getLayout().format(event));
       qSender.send(msg);

     }
     catch(ServiceNotFoundException snfe)
     {
       //handle Exception
     }
     catch(JMSException jmse)
     {
      //handle Exception
  }
     }
     ...
} 


In the log4j.xml file define the custom appender.

... 
 <appender name="events" class="com.EventJmsXmlAppender">
     <errorHandler class="org.jboss.logging.util.OnlyOnceErrorHandler"/>
     <param name="Target" value="System.out"/>
     <param name="Threshold" value="INFO"/>

     <layout class="org.apache.log4j.PatternLayout">
        <!-- The default pattern: Date Priority [Category] Message\n -->
        <param name="ConversionPattern" value="%d{ABSOLUTE} %-5p [%c{1}] %m %n"/>
     </layout>
 </appender>

   
 <logger name="com.LoggingInterceptor" additivity="false">
      <level value="info" />
      <appender-ref ref="events" />
 </logger>
   
 ...


Step 2: Define the interceptor that logs metrics using the custom JMS appender. The interceptor will be invoked on actual method invocation to log the time. The interceptor will forward the request to actual method call via invocation.proceed( ) method call. After invoking the actual method, the time duration for the method execution is calculated. The LOG.info method call will be using the previously defined JMS appender.

package com;

public class LoggingInterceptor implements MethodInterceptor {

    private static final Logger LOG = Logger.getLogger(LoggingInterceptor.class);

    @Override
    public Object invoke(MethodInvocation invocation) throws Throwable {
        long begin = System.currentTimeMillis( );
        ...
        try {
          ...
          Object result = invocation.proceed( );       // run actual method
          ...
          LOG.info("Duration = " + System.currentTimeMillis( ) - begin);
          return result;
        } catch (ResponseUnavailableException e) {
            ....
            throw e;
        } catch (Throwable e) {
            throw e;
        } finally {
           ...
        }
    }

   ..
 
}


In Spring config file wire up the required service(s) and interceptor(s). The TradingService will be making use of the interceptor(s) to log performance metrics.

<bean id="loggingInterceptor" class="com.LoggingInterceptor" />
 
    <bean id="abstractService" abstract="true"  class="org.springframework.aop.framework.ProxyFactoryBean">
        <property name="interceptorNames">
            <list>
                <value>loggingInterceptor</value>
            </list>
        </property>
    </bean>
 
 
     <bean id="tradingService" parent="abstractService">
        <property name="proxyInterfaces">
            <value>com.TradingService</value>
        </property>
        <property name="target">
            <bean class="com..TradingServiceImpl">
                <constructor-arg><ref bean="..." /></constructor-arg>
                <constructor-arg><ref bean=".." /></constructor-arg>        
            </bean>
        </property>
    </bean>


STEP 3: Write a stand-alone JMS listener to retrieve the XML event massages from the queue “jms/EventsQueue” and write to a database table or a file for further analysis and reporting. This can be done via a MDB (a Message Driven Bean in the EJB sepcification), a Spring based JMS listener, or a listener configured via a Message Oriented Broker like web Methods or TIBCO broker.

Labels: ,

Mar 21, 2012

Java Interview Questions and Answers - performance testing your Java application

I have never been in a project or organization that is yet to have any performance or scalability issues. It is a safe bet to talk up your achievements in fixing performance or resource leak issues in job interviews.  It is a pet subject of many job interviewers and if you are in an interview with an organization that is facing performance issue, you will be quizzed on it. Refer to


Q. How would you go about performance testing your Java application?
A.

1. Using a profiler on your running code. It should help you identify the bottlenecks. For example, jprofiler or Netbeans profiler. A profiler is a program that examines your application as it runs. It provides you with useful run time information such as time spent in particular code blocks, memory / heap, etc. In Java 6, you could use the JConsole.


2. You also need to set up performance test scripts with JMeter to simulate the load. Most issues relating to performance bottlenecks, memory leaks, thread-safety, deadlocks, etc only surface under certian load. The performance testing scripts can be recorded while the application is being used and then manually refined. The tools like JMeter HTTP Proxy or Badboy software can be used to trace the script.

3. You could provide a custom solution with the help of AOP (aspect oriented programming) or dynamic proxies to intercept your method calls. Dynamic proxies allow you to intercept method calls so you can interpose additional behavior between a class caller and its "callee".

For example, without AOP or dynamix proxy


public interface Customer {
 
 public abstract void getDetails(String customerId) ;

}

public class CustomerImpl implements Customer{

 public void getDetails(String customerId) {
  long startTime = System.currentTimeMillis();
  try {
   // Actual method body...
   Thread.sleep(2000);
  } catch (InterruptedException e) {
   e.printStackTrace();
  } finally {
   long endTime = System.currentTimeMillis();
   System.out.println("method took: " + (endTime - startTime) + "ms");
  }
 }

}


The above approach is very intrusive. Imagine if you have to add this to 30 to 40 other methods. How do you turn this metrics monitoring on and off without commenting and uncommenting your actual method. With dynamic proxy or Spring based AOP, you can alleviate this problem. Here is an example of the dynamic proxy class.


import java.lang.reflect.InvocationHandler;
import java.lang.reflect.Method;

//uses Java  reflection
public class PerformanceLogger implements InvocationHandler {

 protected Object delegate; //actual object that performs a function

 public PerformanceLogger(Object delegate) {
  this.delegate = delegate;
 }

 @Override
 public Object invoke(Object proxy, Method method, Object[] args)
   throws Throwable {

  long startTime = System.currentTimeMillis();
  
  try {
   Object result = method.invoke(delegate, args); // invoke the delegate
   return result;
  }

  finally {
   long endTime = System.currentTimeMillis();
   System.out.println("method took: " + (endTime - startTime) + "ms");
  }
 }

}


Note: If you are using Java 5 or higher use the System.nanoTime( ) instead of System.currentTimeMillis(). For example,


long start = System.nanoTime(); // requires java 1.5
//some process
double elapsedTimeInSec = (System.nanoTime() - start) * 1.0e-9;

The test class that tests the above code

import java.lang.reflect.Proxy;


public class PerformanceTest {
 
 
 public static void main(String[] args) {
    Customer cust = new CustomerImpl();  
    PerformanceLogger pl = new PerformanceLogger(cust); 
    cust = (Customer)Proxy.newProxyInstance(CustomerImpl.class.getClassLoader(), new Class[] {Customer.class}, pl);
    cust.getDetails("8");
      
 }

}


With this approach, you don't need to put the System.currentTimeMillis( ) in your delegate classes. It only needs to be in PerformanceLogger, and it will intercept actual calls to the delegates to print performance metrics. If you want to make changes as to how the metrics are collected or want to turn off System.currentTimeMillis( ), you will only have to do it in one class, that is the dynamic proxy class PerformanceLogger.

If you are using Spring, you could use the AOP based interceptors. The AOP based deadlock retry using Spring is using a very similar approach for dead lock retry.

Note:I have been in interviews where the interviewer was more interested in the custom solution by asking

Q. If you did not have a profiling tool, how would you go about gathering performance metrics?
A. AOP or dynamic proxy based solution as discussed above. You could also mention the built-in command-line and graphical tools that come with Java  like JConsole, jstack, jmap, hprof, vmstat, etc. But the main focus must be via interceptors.

Design pattern: If you are asked to describe or talk about a design pattern, you could mention this dynamic proxy class as a proxy design pattern. Many pick either singleton or factory design pattern. It would be nicer to pick something other than these two common patterns. Some interviewers specifically ask you to pick anything except factory and singleton design pattern.

Q. What tips do you give someone regarding Java performance?
A.


1. Don't compromise on design: You should not compromise on architectural principles for just performance. You should make effort to write architecturally sound programs as opposed to writing only fast programs. If your architecture is sound enough then it would allow your program not only to scale better but also allows it to be optimized for performance if it is not fast enough. If you write applications with poor architecture but performs well for the current requirements, what will happen if the requirements grow and your architecture is not flexible enough to extend and creates a maintenance nightmare where fixing a code in one area would break your code in another area. This will cause your application to be re-written. So you should think about extendibility (i.e. ability to evolve with additional requirements), maintainability, ease of use, performance and scalability (i.e. ability to run in multiple servers or machines) during the design phase. List all possible design alternatives and pick the one which is conducive to sound design architecturally (i.e. scalable, easy to use, maintain and extend) and will allow it to be optimized later if not fast enough. Once you get the correct design, then measure with a profiler and optimize it.

2. Be aware of the death by thousand-cuts: Having said not to compromise on the design,  one needs to be mindful of  performance inefficiencies that can creep in throughout the software development. For example, an inefficient method being called 50-100 times can adversely impact performance. A real-life example would be a JSF application that invokes its life-cycle methods many times. So, having a long-running subroutine within the life-cycle method might end up calling it more than once. So, know your best practices and potential pitfalls. Here are a few things to keep in mind.

  • Use immutable objects where applicable. Immutable objects are inherently thread-safe and can also be reused. A good candidate for implementing the flyweight design pattern. The following Java method is an example of flyweight.

Integer.valueOf(String s)

        It keeps some amount of the created Integers internally, so, when you pass the String that you have
        passed before - it returns you an existing instance.


  • Check your regexes and SQL queries for backtracking and Cartesian joins respectively.


  • Define your objects and variables with the right scopes. The variables need to be defined at the lowest scope possible (e.g local --> instance --> static)
  • Use proven libraries, frameworks, built-in algorithms, and data structures as opposed to creating your own. For example, when handing concurrency use java.util.concurrent package.

3. Always have a performance focus by developing proper load testing scripts and benchmarks. The non-functional requirements should cover the relevant SLAs (i.e. Service Level Agreements). Tune your application server, database server, application, etc where required with proper bench marking and load testing scripts. The mission critical applications must have run time metrics gathering in place commercial tools. There are tools that can be used in production environment like YourKit for Java, JProfiler for Java, etc and for larger distributed and clustered systems with large number of nodes there are profilers like CA Wiley Introscope for Java, ClearStone for Java, and HP Performance managers. These tools are handy for proactive detection and isolation of server/application bottlenecks, historical performance trend tracking for capacity planning, and real-time monitoring of system performance.

Q. When designing your new code, what level of importance would you give to the following attributes? Rank the above attributes in order of importance?  

-- Performance
-- Maintainability
-- Extendibility
-- Ease of use
-- Scalability


Rank the above attributes in order of importance?  

A. This is an open-ended question. There is no one correct order for this question. The order can vary from application to application, but typically if you write 1 - extendable, 2 - maintainable and 3 – ease of use code with some high level performance considerations, then it should allow you to  optimize/tune for 4 - performance and 5 - scalability. But if you write some code, which only perform fast but not flexible enough to grow with the additional requirements, then you may end up re-writing or carrying out a major revamp to your code.

Note: These types of questions have no right or wrong answers, but can reveal a lot about your experience, passion, and attitude towards building a quality software. Good software developers and architects are opinionated based on their past experiences.

For writing  load/performance/stress testing scripts, the JMeter is a very useful free tool. Learn more about Java performance testing with JMeter

Labels: ,