Top 5 Eclipse debugging tips tutorial style
Good debugging skills can not only make you more productive, but also can be used in job interviews to determine your experience. The remote debugging was already discussed using eclipse, which is very handy if you have a scenario where you can't reproduce locally what your client is experiencing. In this case, you can set up the remote debugger using eclipse. In this blog I will go through some handy debugging options using eclipse IDE. Similar, options are available in other popular IDEs as well.
Q1. How will you go about getting the debugger to stop on NullPointerException, which is thrown on line E in the code below?
import java.util.Map;
import java.util.concurrent.ConcurrentHashMap;

public class MyClassWithACollection {

 //map instance variable
 private Map<integer, Country> fromMap =
          new ConcurrentHashMap<integer, Country>(10);
 //class variable
 private static Map<integer, Country> toMap =
           new ConcurrentHashMap<integer, Country>(10);


 public static void main(String[] args) {
  MyClassWithACollection mcc = new MyClassWithACollection(); //Line X
  mcc.fromMap.put(1, new Country("India"));                  //Line Y
  mcc.fromMap.put(2, new Country("UK"));
  mcc.fromMap.put(3, new Country("USA"));
  System.out.println(mcc.fromMap);          //Line A

  //copy from fromMap to toMap
  mcc.toMap.putAll(mcc.fromMap);            //Line B
  System.out.println(mcc.toMap);            //Line C

  mcc.fromMap = null;                       //Line D
  //throws a null pointer exception
  System.out.println(mcc.fromMap.values()); //Line E

 }

 //inner class
 public static class Country {
  String name;

  public Country(String name){
     this.name = name;
  }
 }

}
A1. You can get the debugger to stop at a particular exception as ashown below.
1. go to the debug window
2. click on j! icon that brings up the modal panel to search and select the exception to set the break point on

3. Select the exception type.
4. Click okay.
5. Select the "MyClassWithACollection" file and right click to get the contextual menu and and then select Debug As --> Java Application as shown below, which will stop the debugger on Line E, where the NullPointerException will be thrown as mcc.fromMap was set to null on Line D.
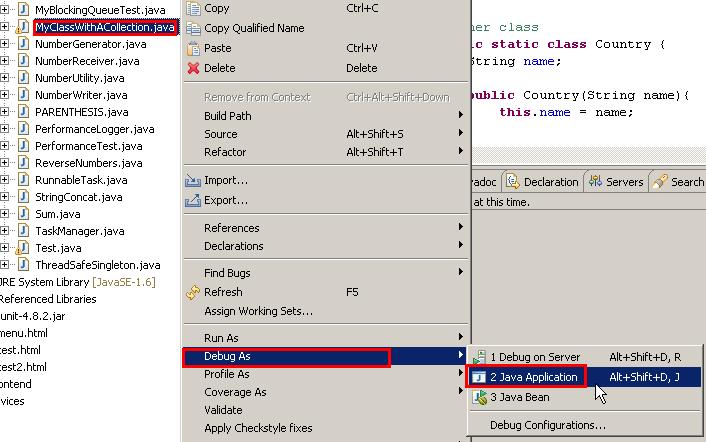
Note: For all the Q&A below, you need to use the above Debug As --> Java Application.
Q2. If you want to inspect the contents of "mcc.fromMap" on Line A, how will you go about accomplishing it?
A2. In eclipse you could follow the following steps
1. Set a break point on "Line A" by double clicking on the left hand side of the eclipse editor as shown below to set the break point.
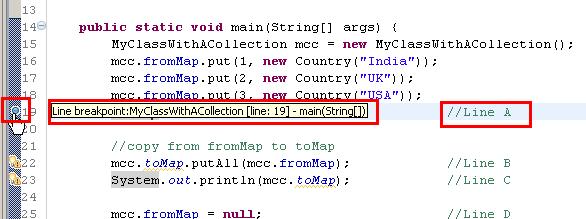
2. When you run the program in debug mode as explained earlier, the debugger will stop on the break point. 3. Go to the variables tab, and then make sure the "Logical Structure" icon shown in the diagram below is turned on by clicking it as shown below.

4. When the logical structure is turned on, you can easily drill into the "mcc.fromMap" as shown above to inspect the values. This approach can be used for all collection types.
Q3. How will you inspect the contents of the static variable "mcc" on Line X oand contents of the static variable "mcc.toMap" on Line C?
A3. To inspect a local variable "mcc" on Line X
1. Put the break point on Line Y.
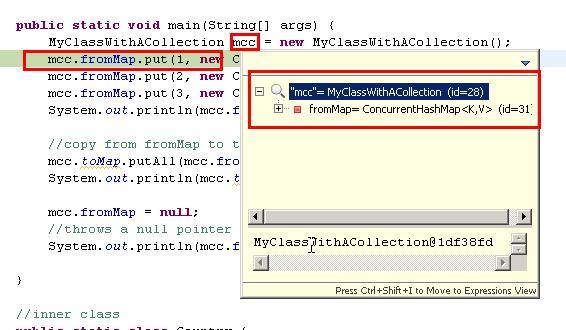
2. When it stops on Line Y, highlight mcc on Line X, and then right click to get the contextual menu as shown below.

3. You could then select "Inspect" to get a pop up that inspects the variable as shown below.
4. Alternatively, you could select watch from the contextual menu which will display the local and static variables. You could even add expressions to stop when a variable has a particular value like null.

You can even edit the watch with expressions as shown below.

5. As you step through one line at a time, you can see the watch values changing.
Q4. Since Line B is a method from the Java API, how will you get eclipse to not step into the break point on Line B even if you press F5 (step into), and go to the next break point?
A4. You can achieve this via setting up the "Step Filters" in eclipse preferences.
1. Go to Window --> Preferences and you will get a modal popup window.
2. Follow the rest of the steps as shown below.

3. If you try debugging now, the debugger will stop at Line B, but if you press step into or F5, the code will not step into the putAll method, and step over to the next break point instead.
The best way to learn is by trying the above code.
Related posts:
Labels: Eclipse Tutorial
posted by Unknown at
5/31/2012 06:03:00 PM
![]()
![]()

1 Comments:
Thanks for the useful tips
Post a Comment
Subscribe to Post Comments [Atom]
<< Home